Network Diagnostics App Screenshot Template — Signal Check
Create a coordinated screenshot campaign for a network diagnostics app: technical graphite and cyan, editable chart grid and graph trace, and five layouts for overview, test, result, history and diagnostics.
- 5 slides · 10 screenshot slots
- Editable headlines, descriptions, background and 4 SVG decoration types
- Verified: iPhone 6.9″ portrait master (1320 × 2868 px).
- No account needed — opens in your browser; nothing is uploaded.
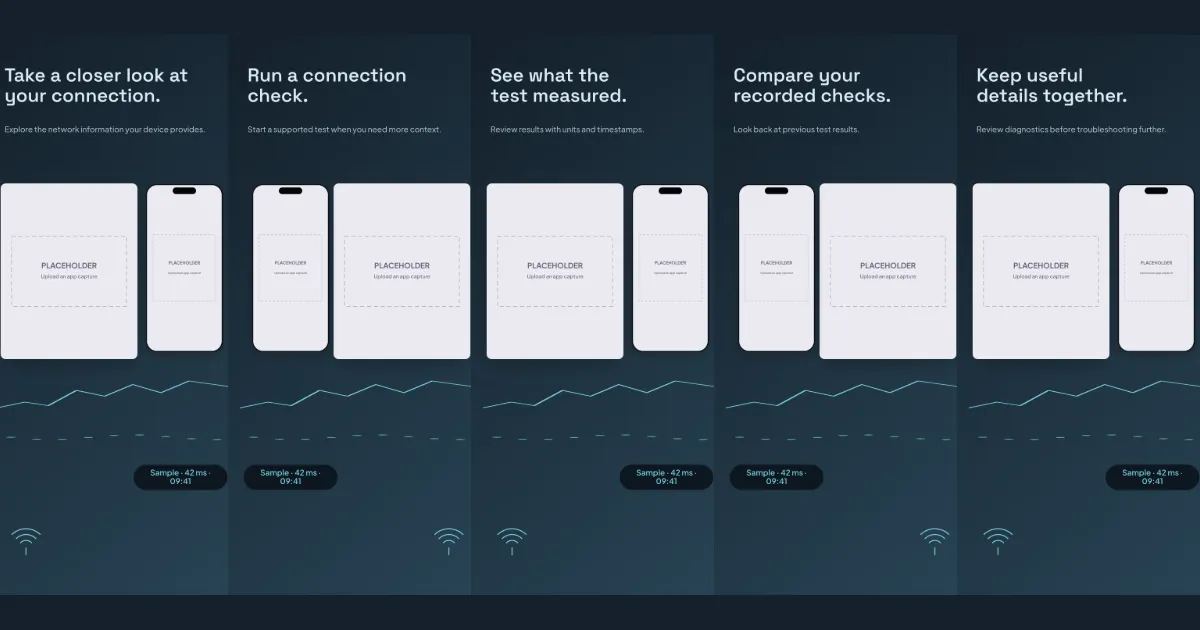
All five slides, in order
Swipe or use the slide links
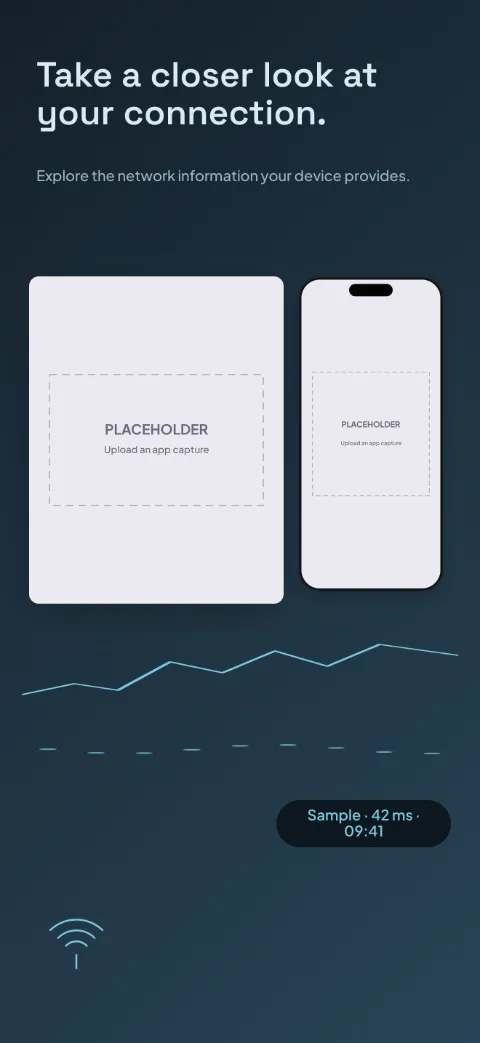
1 · Promise
Take a closer look at your connection.
Explore the network information your device provides.
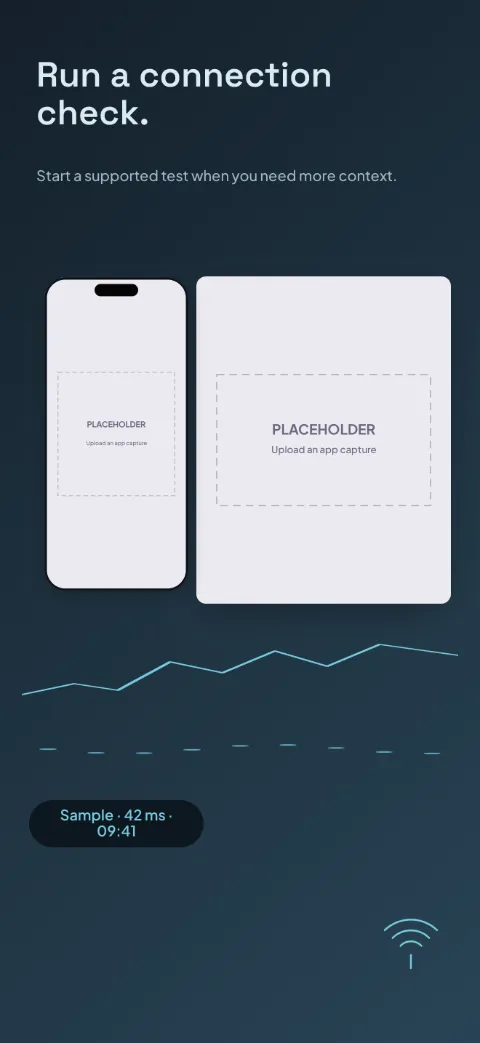
2 · Primary feature
Run a connection check.
Start a supported test when you need more context.
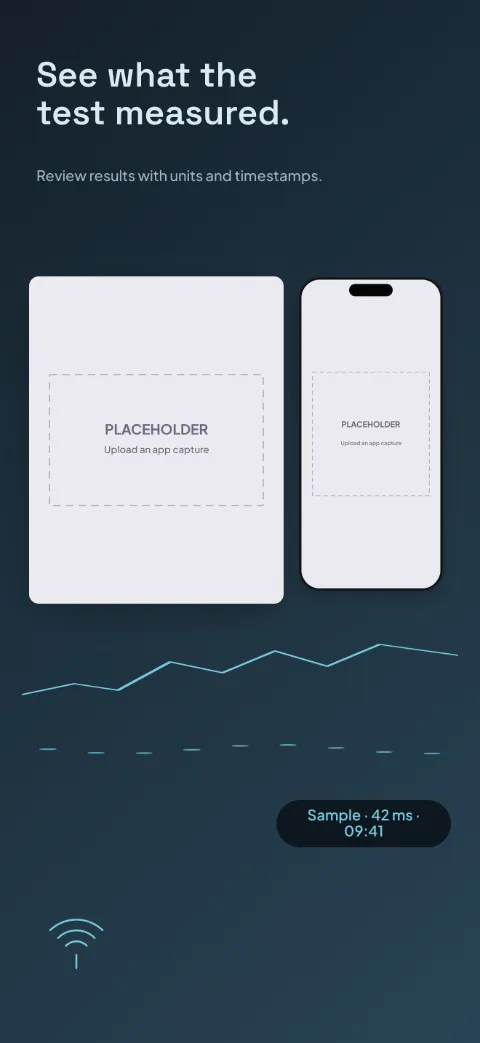
3 · Secondary feature
See what the test measured.
Review results with units and timestamps.
4 · Personalisation
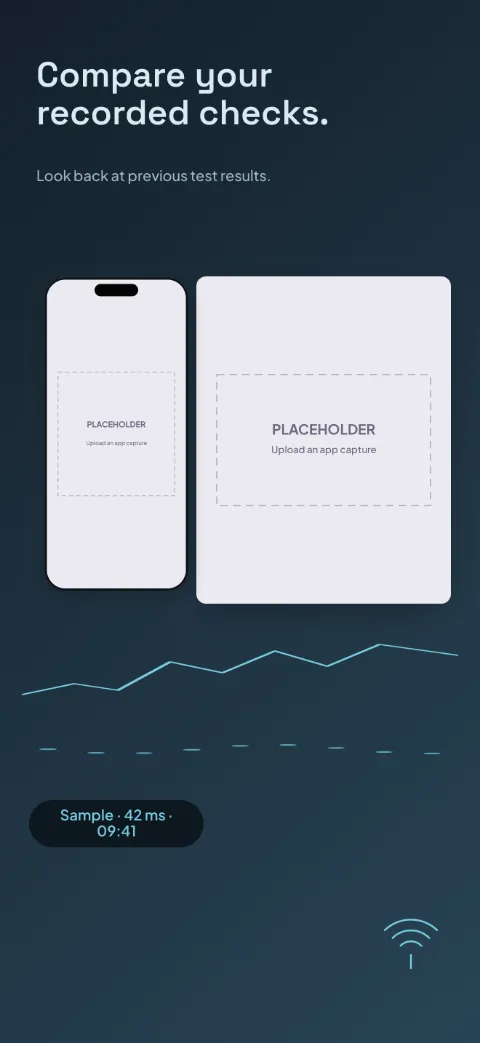
Compare your recorded checks.
Look back at previous test results.
5 · Closing
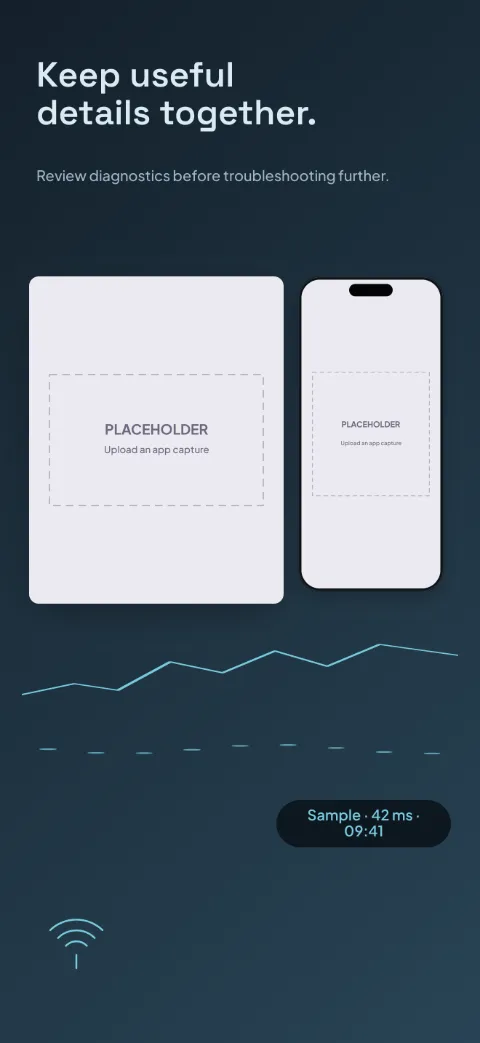
Keep useful details together.
Review diagnostics before troubleshooting further.
The story the slides tell
Dashboard crops plus one device: a large magnified crop with graph traces, a fictional reading card with units, phone to the side.
- Slide one — promise: shows overview (dashboard crop) + overview, decorated with chart grid and graph trace. Example copy: “Take a closer look at your connection.” / “Explore the network information your device provides.”
- Slide two — primary feature: shows test (dashboard crop) + test, decorated with chart grid and graph trace. Example copy: “Run a connection check.” / “Start a supported test when you need more context.”
- Slide three — secondary feature: shows result (dashboard crop) + result, decorated with chart grid and graph trace. Example copy: “See what the test measured.” / “Review results with units and timestamps.”
- Slide four — personalisation: shows history (dashboard crop) + history, decorated with chart grid and graph trace. Example copy: “Compare your recorded checks.” / “Look back at previous test results.”
- Slide five — closing: shows diagnostics (dashboard crop) + diagnostics, decorated with chart grid and graph trace. Example copy: “Keep useful details together.” / “Review diagnostics before troubleshooting further.”
How to use Signal Check
- Open the template in Screenshot Studio. “Use this template” opens a new-project dialog in your browser; nothing is saved until you choose Create.
- Upload and map your app screenshots. Slots are named Overview, Test, Result, History, Diagnostics.
- Edit the headlines and supporting descriptions. Click any text on the canvas or use the copy table for every language.
- Apply your colours, fonts and target sizes. Brand kits and per-size adjustments keep the master layout intact.
- Preview, validate and export. Validation flags empty slots, overflowing text and missing fonts before the PNG export.
Advice for this template
- Use a overview screen for slide one, a test screen for slide two, a result screen for slide three, then history and diagnostics screens for slides four and five.
- 5 slots are zoomed close-ups; supply a separate capture (or the same one, then pan the crop) so the detail stays sharp.
- On this dark palette, check that small screenshot text still reads in Preview at store size.
- Use legible editor captures and keep code examples large enough to read in the final artwork.
Questions
- Which app screens work best in this template?
- In order: overview, test, result, history and diagnostics. Each slide has a named screenshot slot so captures map by position.
- Can I replace the device frame?
- Yes. Each screenshot slot can switch between the generic drawn frame styles (including frameless cards). Realistic manufacturer device artwork is not bundled.
- Can I change the gradient colors?
- Yes. The background is an ordinary editable gradient; the template also offers a matching solid colour and an alternate light/dark treatment.
- Can I use this design for both platforms?
- Yes. Projects can target App Store and Google Play sizes together. The master layout is 1320 × 2868; other sizes are resized proportionally, and you can adjust any size individually.
- Which parts remain editable?
- Every headline and description, screenshot slot, background and SVG decoration is an ordinary named layer you can edit, recolour, move, hide or delete.
Related templates
Start from Signal Check
Opens a new project in your browser with all five slides editable. Your existing projects are not changed.
Use this template